As a quick review of the performance of different branches of the PPC family, based on CPU performance scores in the Norton System Info benchmark…
If you compare a 601 (6100/66), a 603ev (4400/200) (603 (6200/75)), a 604e (9500/200) and a 750 (upgraded 9500 with 400MHz G3), all normalised (scaled) to the same speed (in MHz), each with an L2 cache, they scale as follows…
601@66MHz (112) = 100%, 100% Normalised
603ev@200MHz (268) = 269%, 79% Normalised
(603@75MHz and 32bit RAM (95) = 85%, 75% Normalised)
604e@200MHz (376) = 336%, 111% Normalised
750@400MHz (1026) = 916%, 151% Normalised
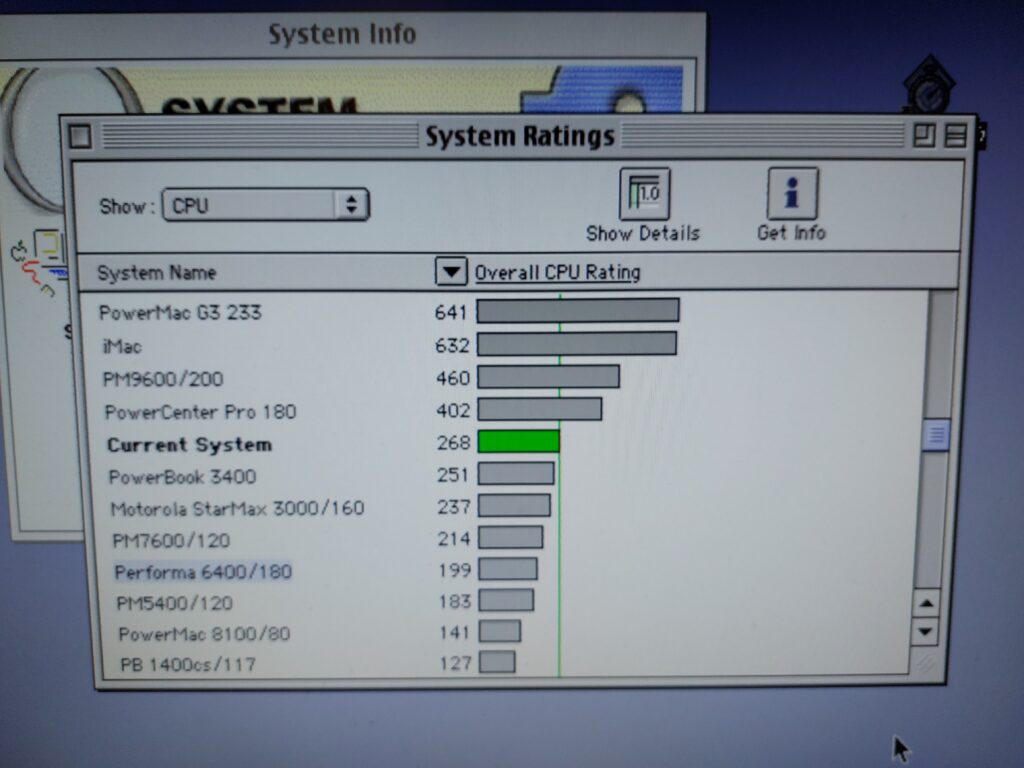
These are all scores using my own hardware. For reasons I don’t understand, the built in scores in Norton don’t match very closely – their 604e in particular does better than mine by a lot. Using their scores, the difference is as follows…
601@60MHz = 100%, 100% Normalised
603ev@180 = 199%, 66% Normalised
603e@160 = 237%, 89% Normalised
603e@120 = 183%, 92% Normalised
604e@200 = 460%, 138% Normalised
750@233 = 641%, 165% Normalised
The built in score machines were a 6100/60, 6400/180, a StarMax 3000/160, a 5400/120, a 9600/200 and Beige G3. The difference in performance between the 6400 and Starmax may be a result of L2 cache, but seems absurdly large. Somehow the 120MHz 5400 almost matches a 601 based machine.
Note that the exact scores vary differently between the families depending on compiler optimisation. I’ve previously noticed that the 603 family in particular seems to benefit when compared to the 601 with later compilers. Additionally, as mentioned, there is inexplicable differences between some scores that Norton saw, and what I get with my own machines.
This said, overall, the performance per-MHz is 603<601<604<750.
Note that bus speeds aren’t consistent between the various machines, which will give machines such as the 9600 an advantage in RAM access.